[ analysts ]
The whole match, without letting go of the keyboard.
One key per action, a number for the player or the descriptor, and the clip is done. What you tag is what you later measure, cut and send.
[01]Speed
Tag at the speed of the match.
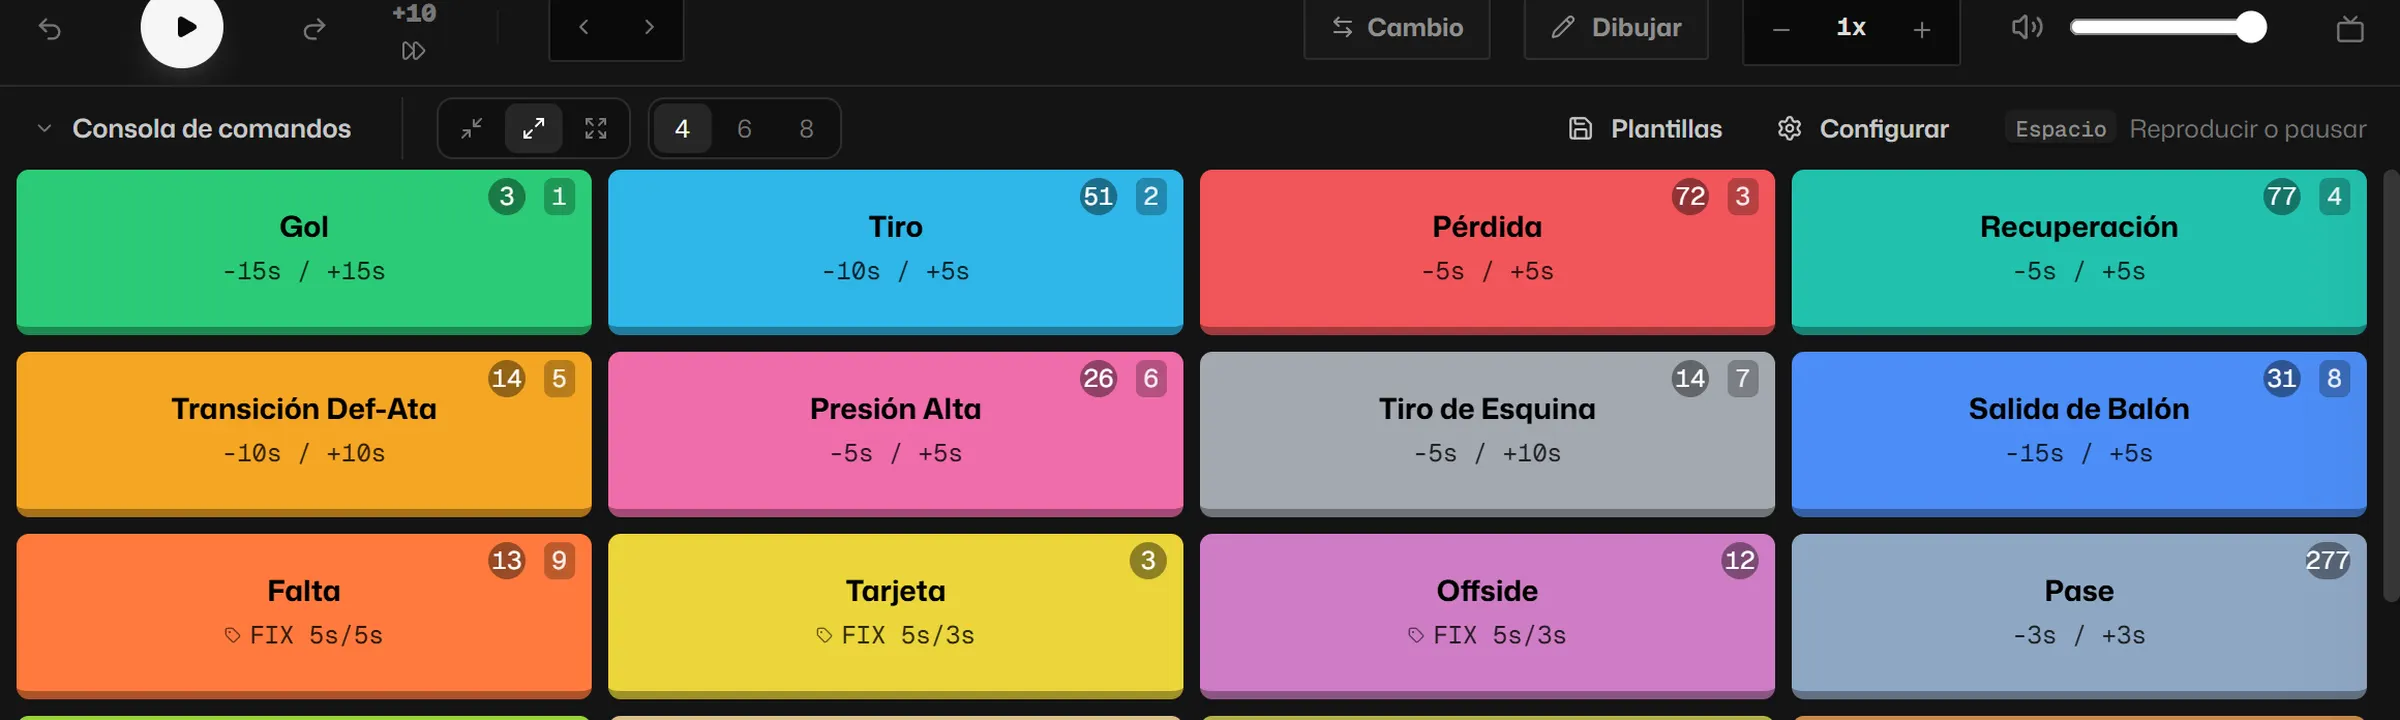
- Consoles for every job. Full analysis, attacking, defending, transitions, set pieces, individual performance, goalkeeper and possession. Pick one when you create the project or build your own.
- Keys 1 to 9. Every tag gets its key from its place on the console. If you prefer others, change them in Settings.
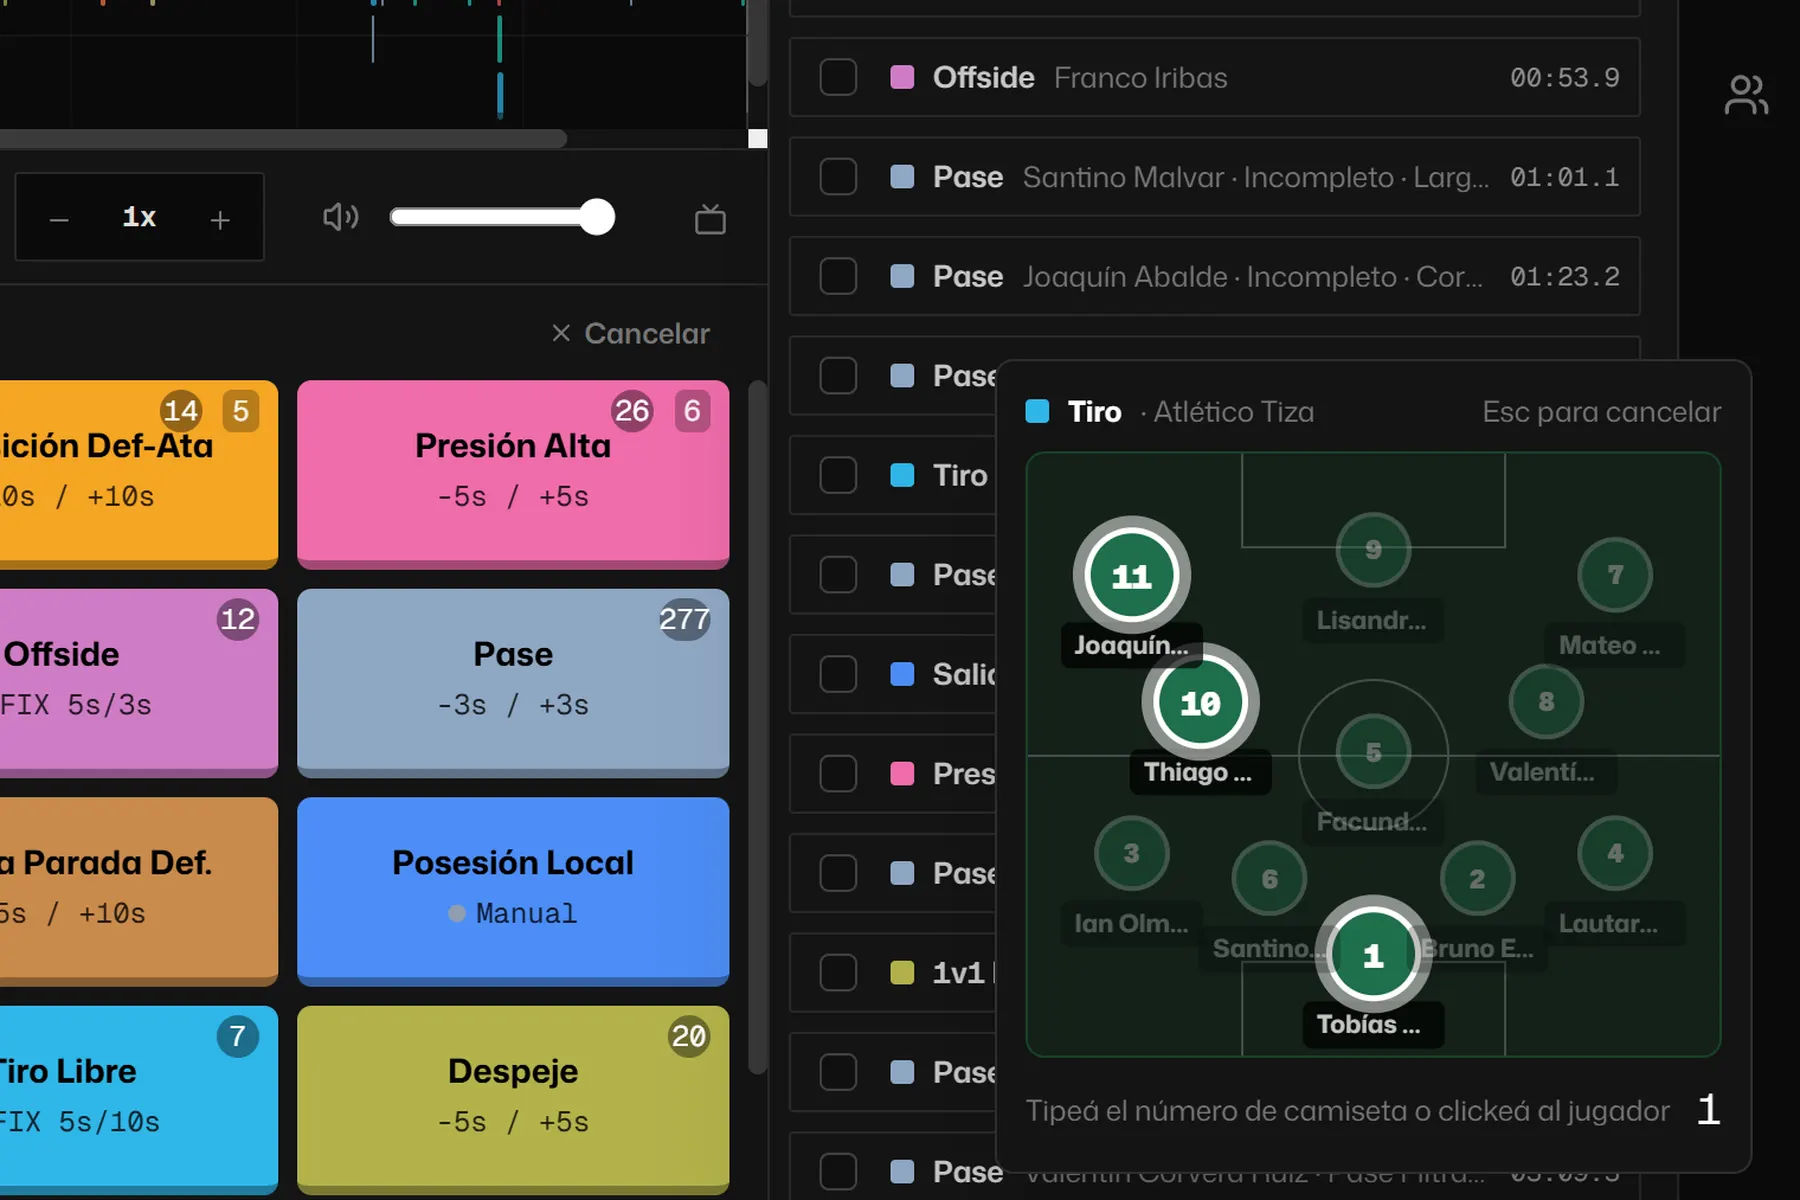
- Two keystrokes. The action key and the number of the descriptor or the player’s shirt. No windows to open.
- Continue with. Chain the actions that come next and the logging desk walks through them one by one, each clip starting where the previous one ends.
[02]The logging desk
Two screens, one logging desk.
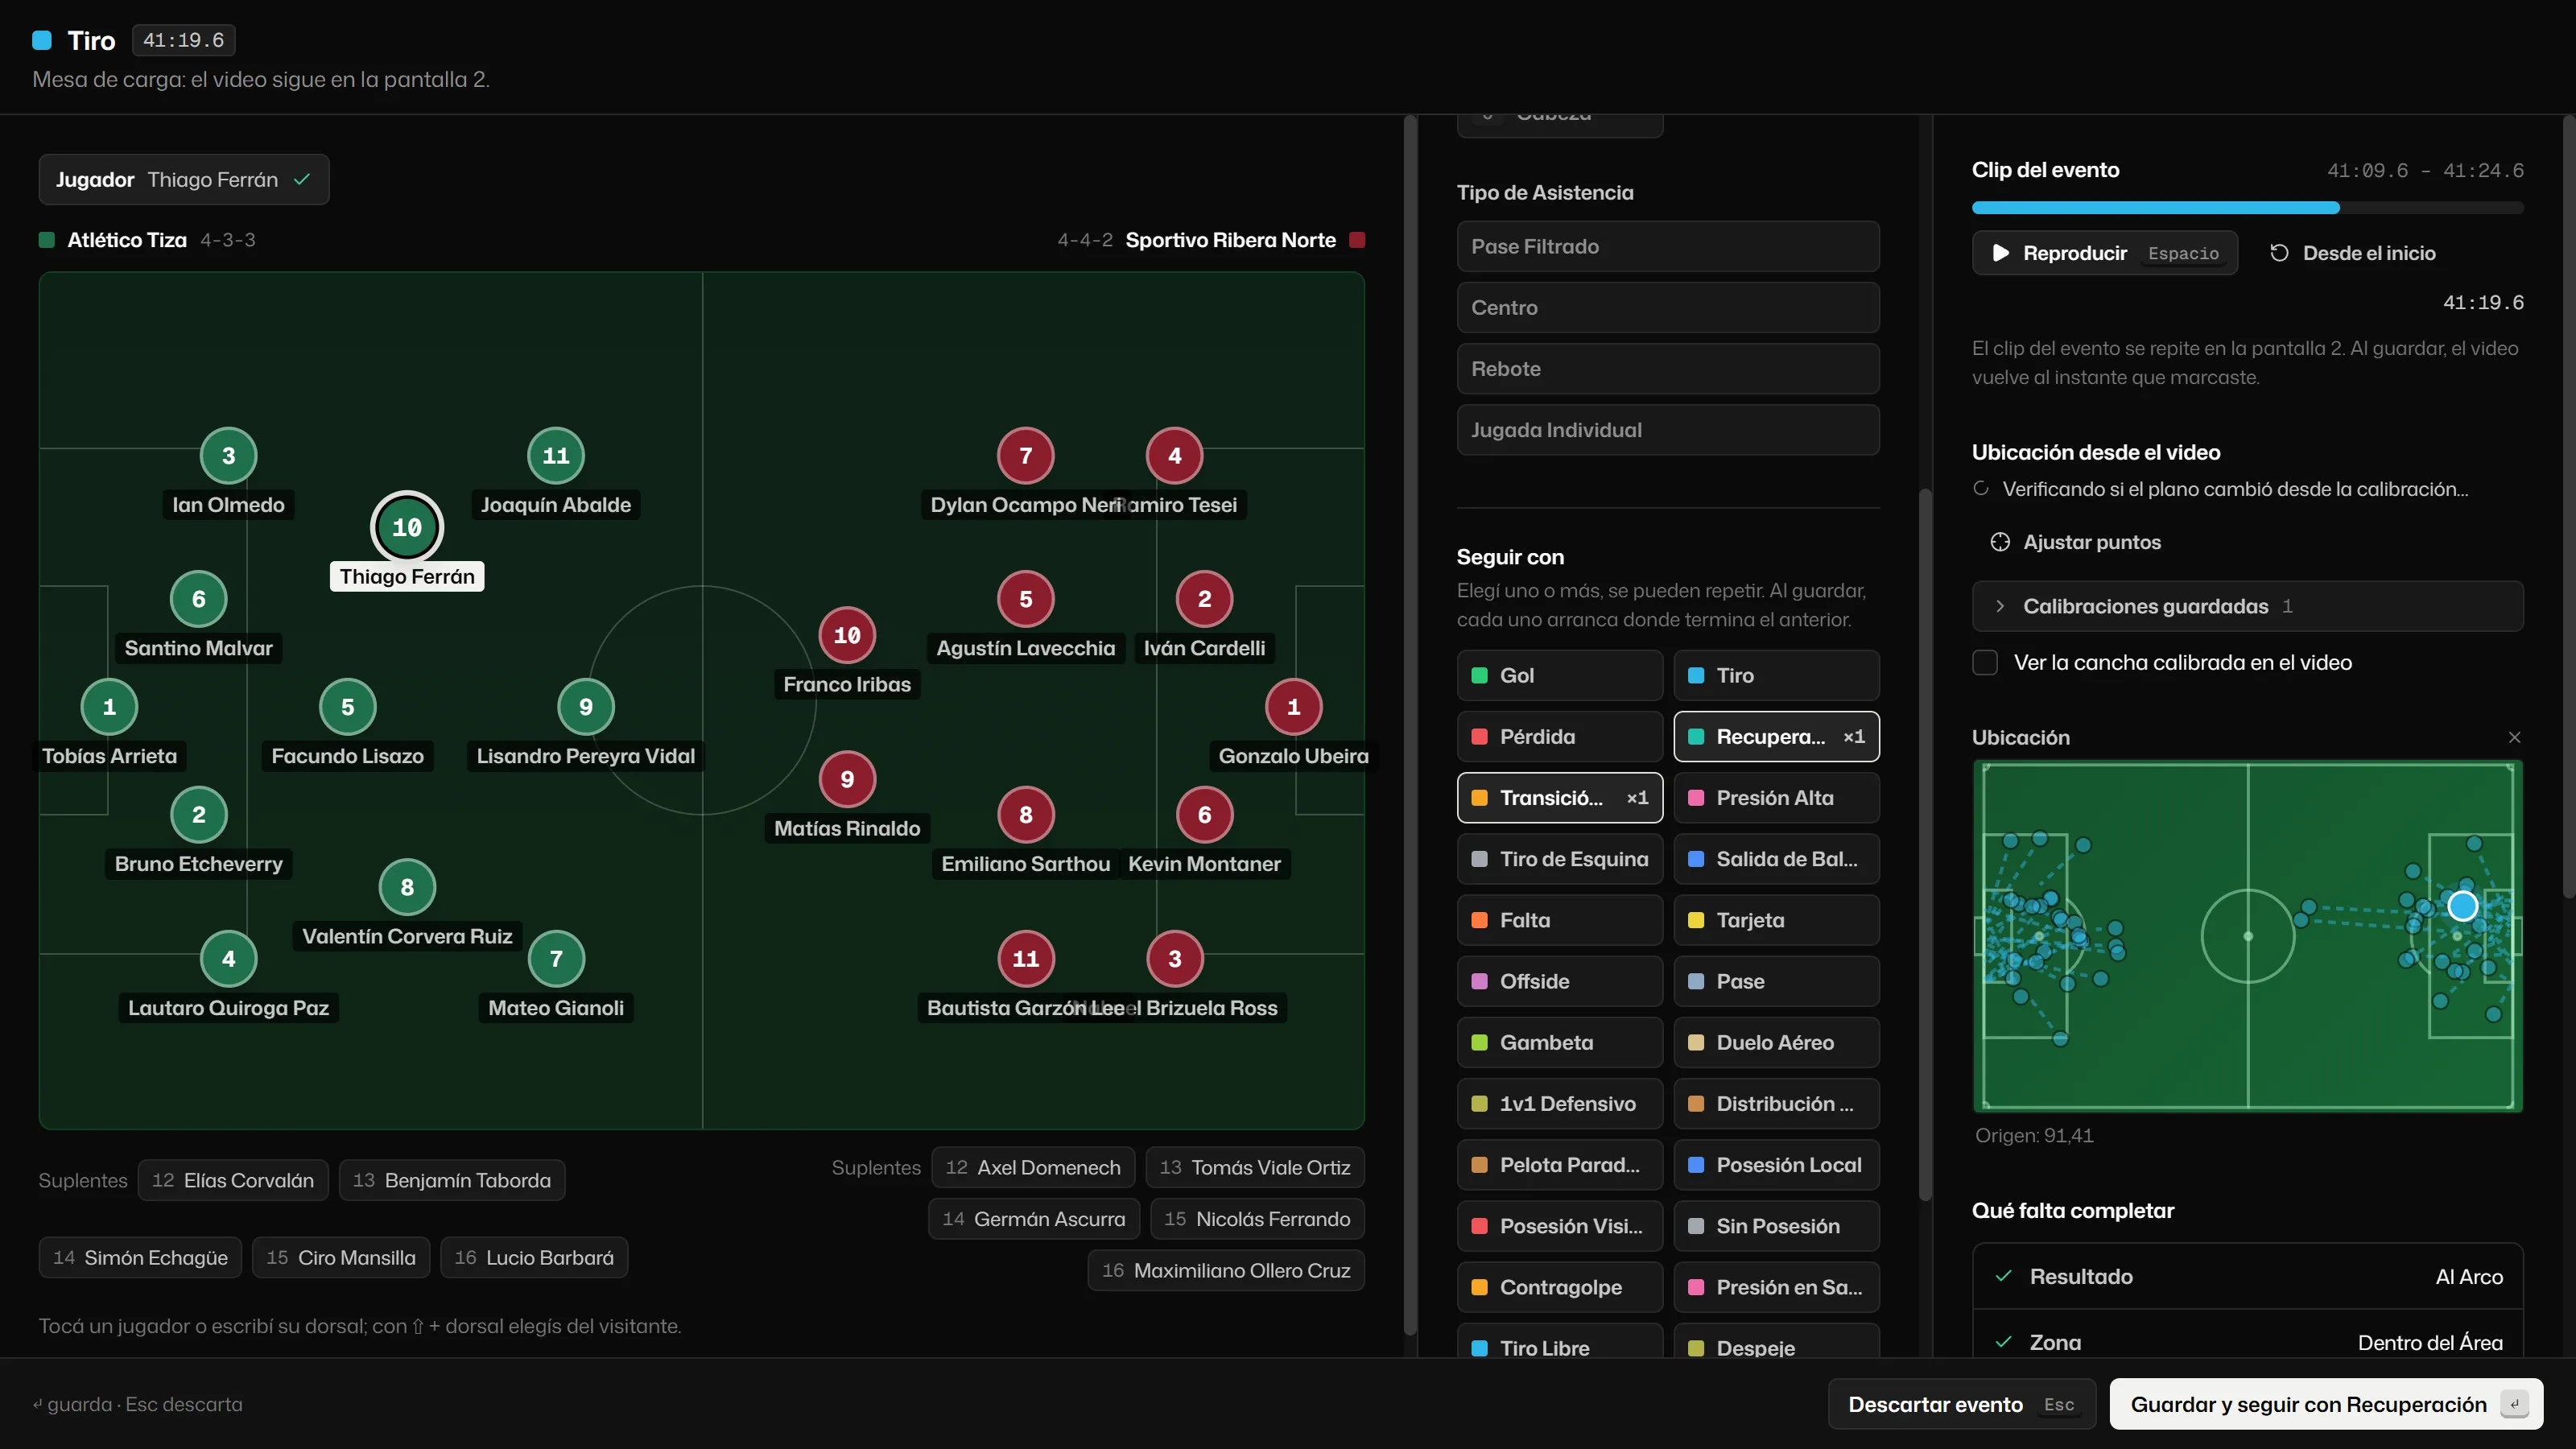
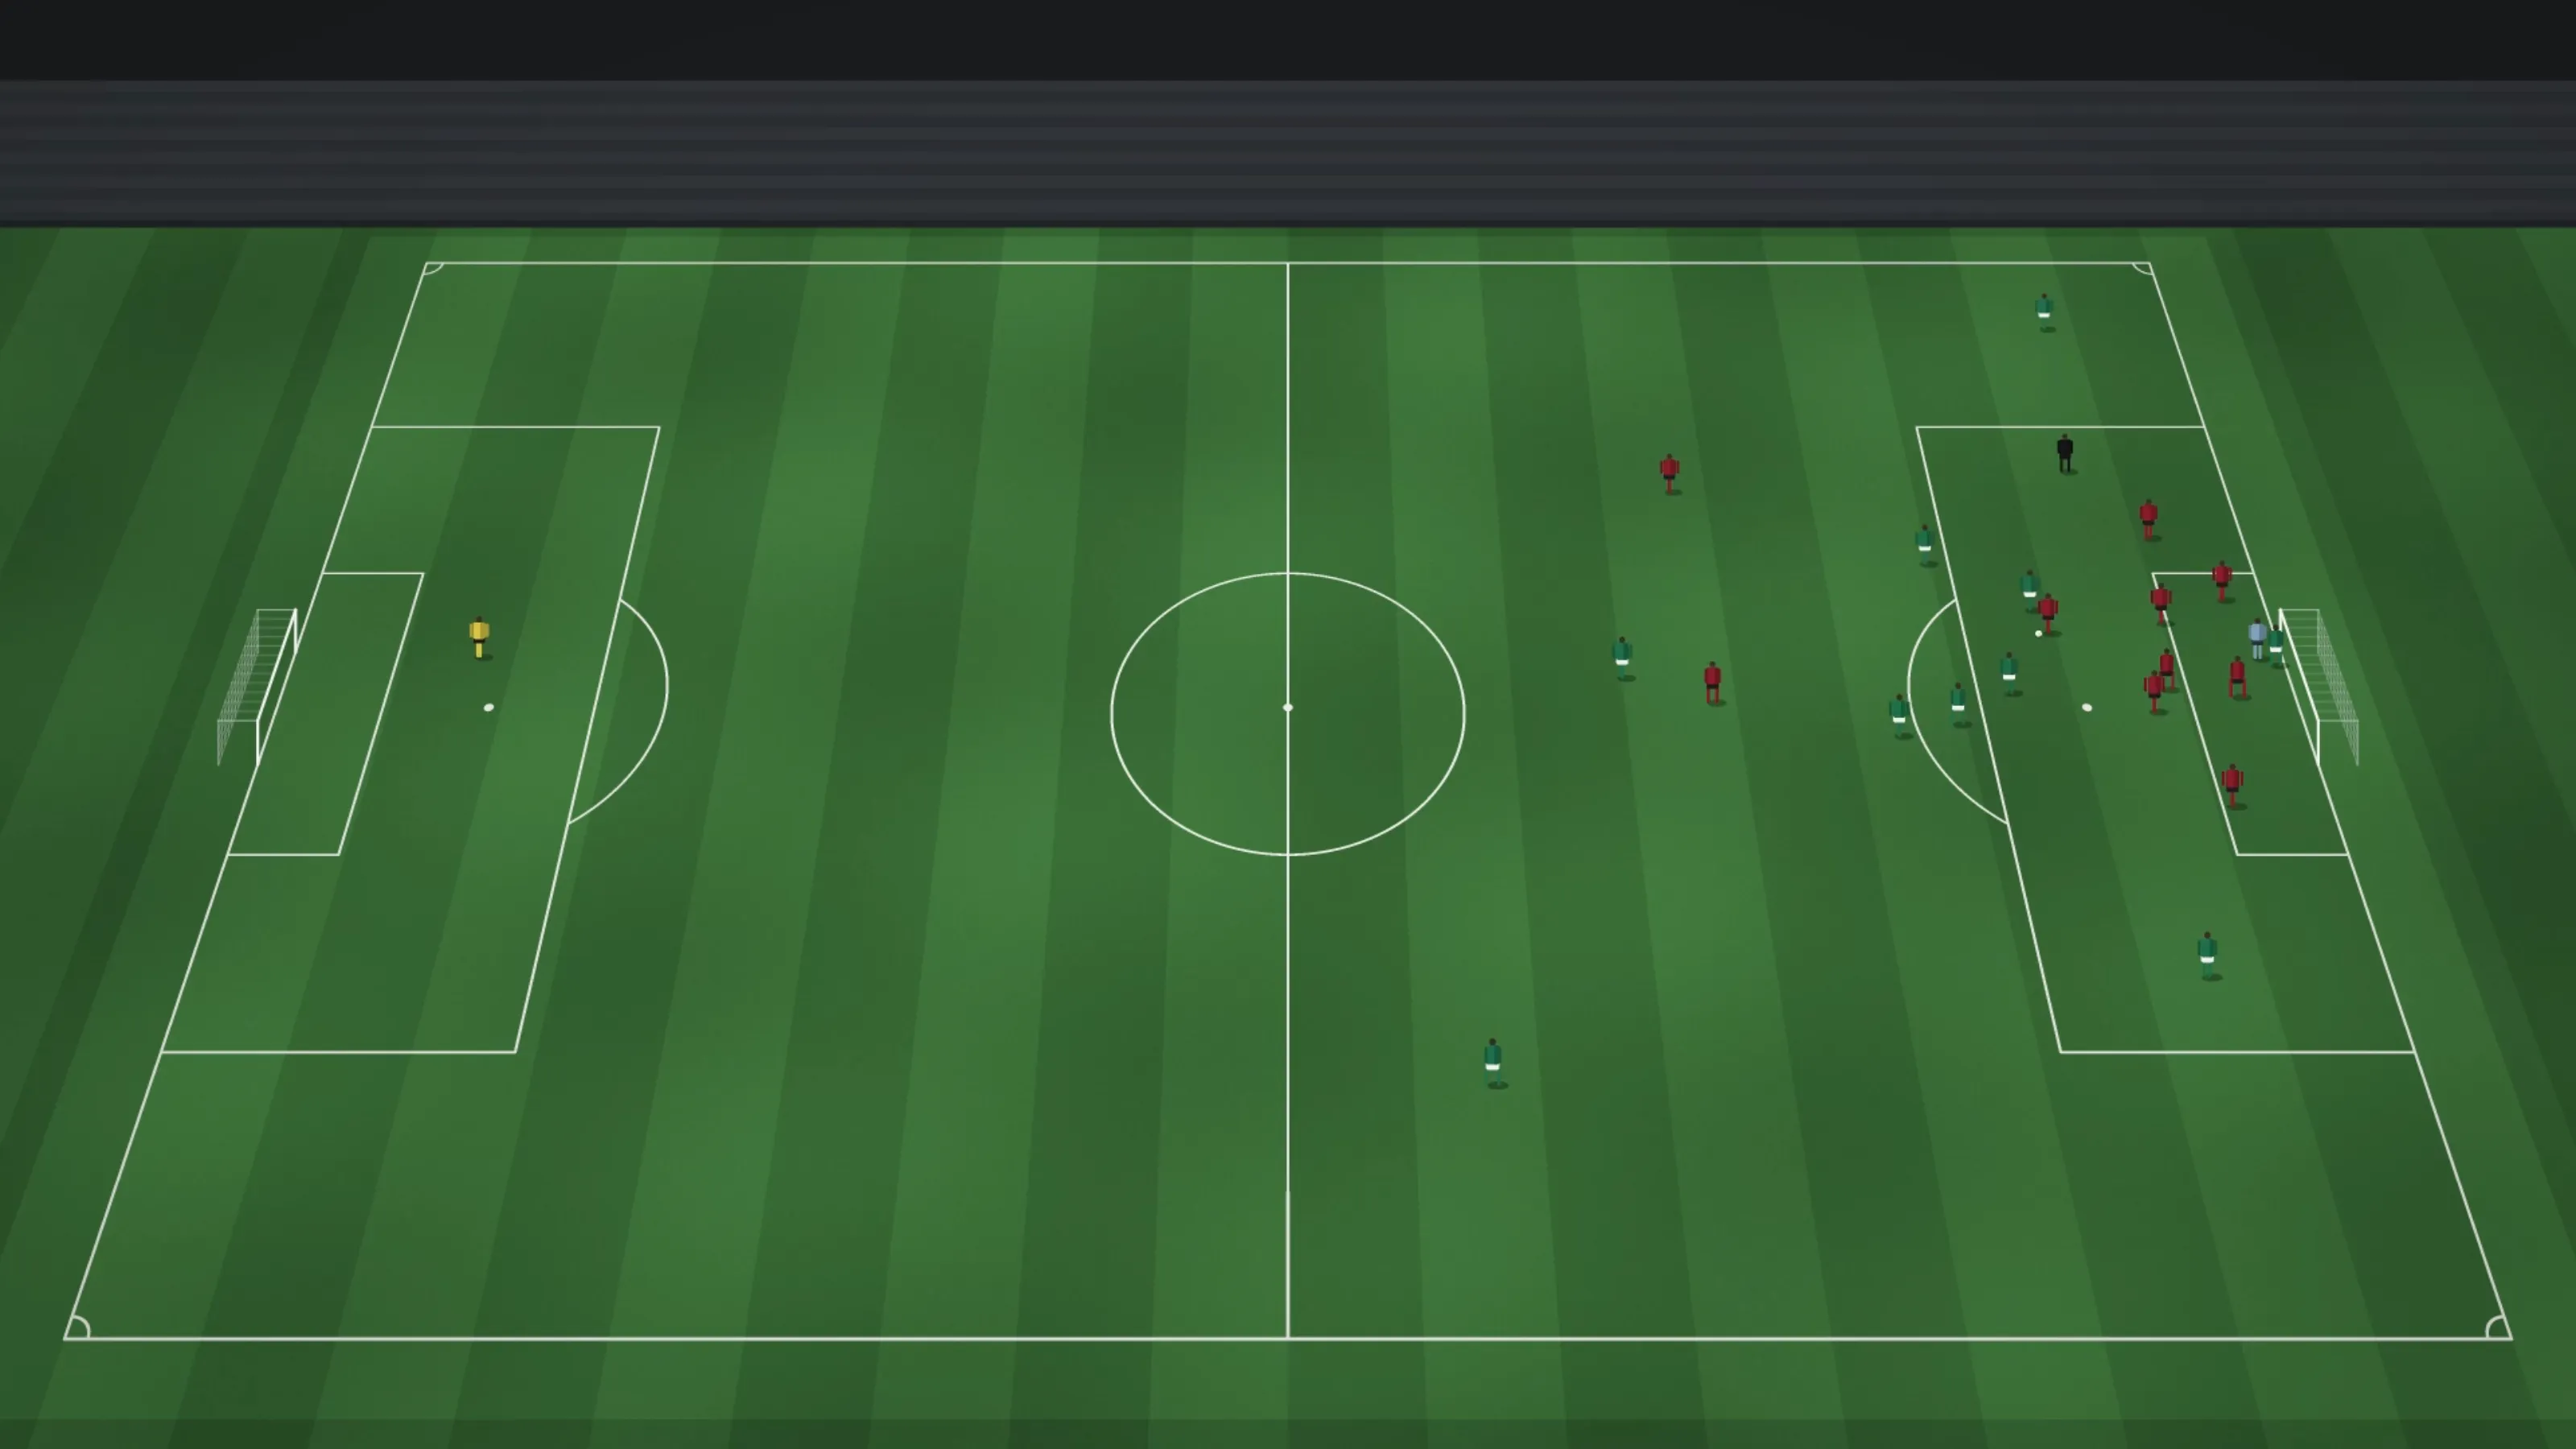
With two monitors, the event details take up a whole screen: the large pitch with both squads, the options and the mini-map with earlier actions. The event clip loops while you fill it in. Tap the player, tap the spot and move on.
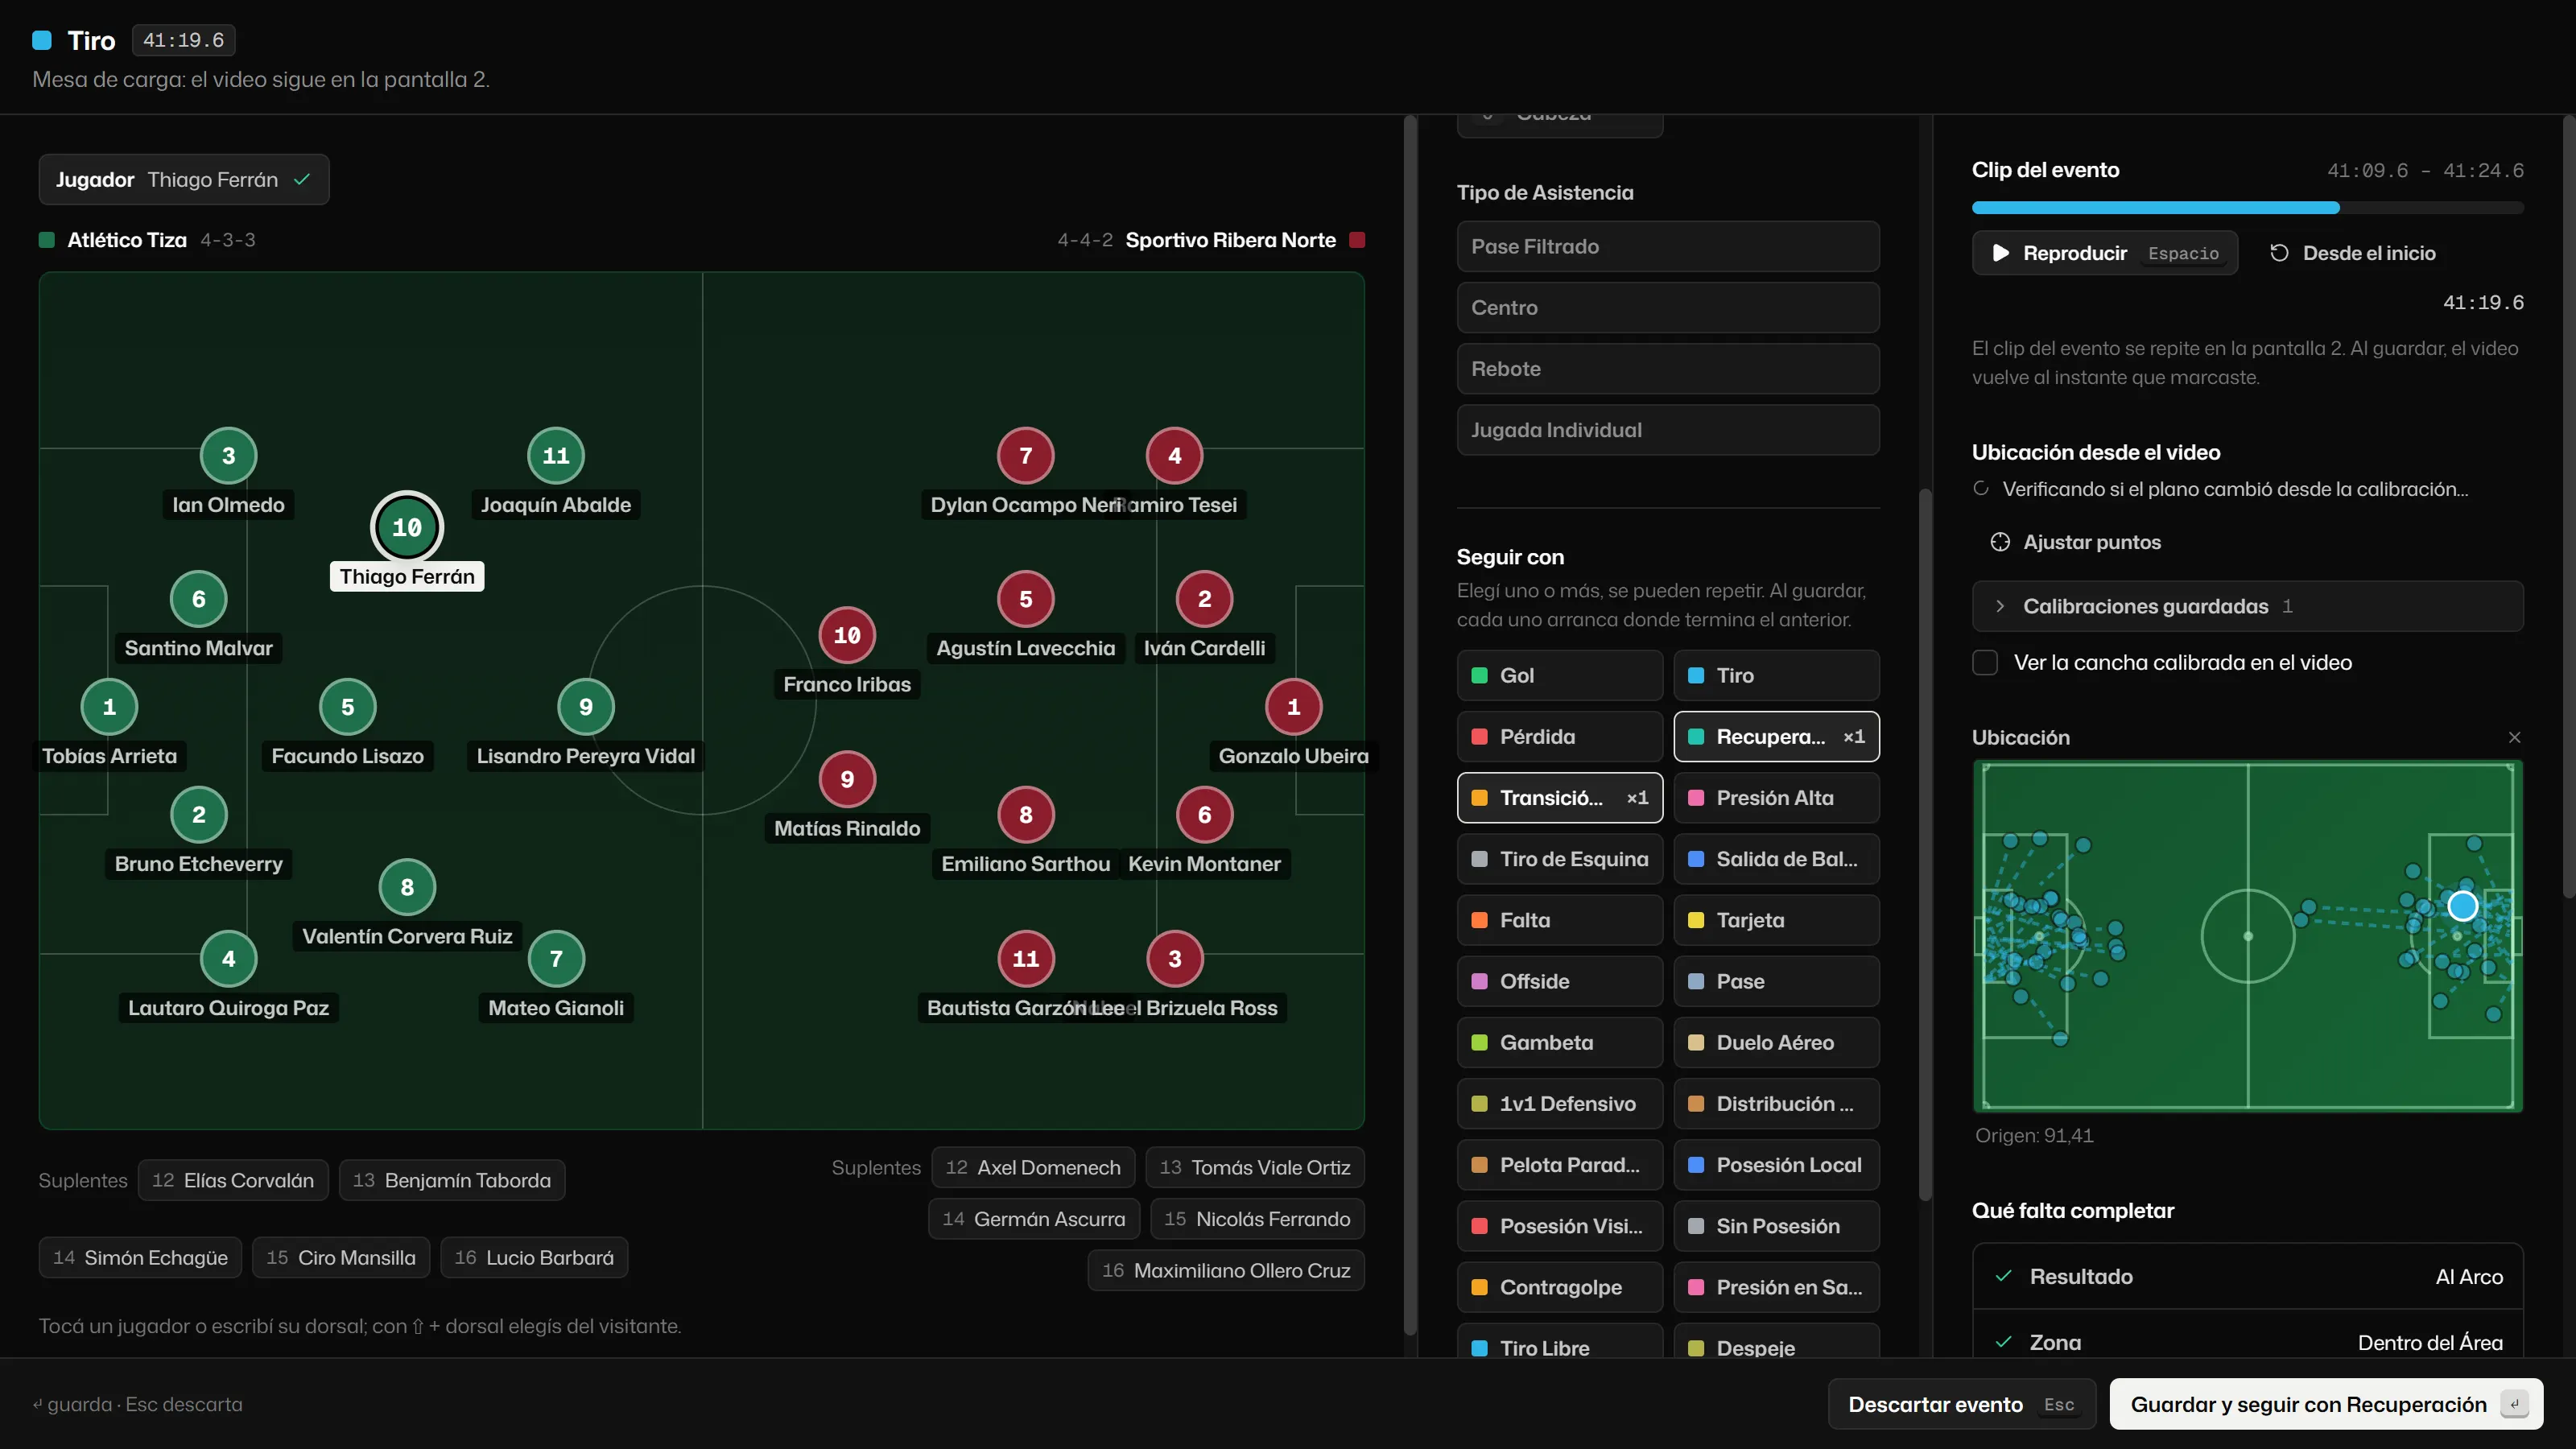
1 The logging desk
2 The video
[03]Precision
Every action in its place on the pitch.
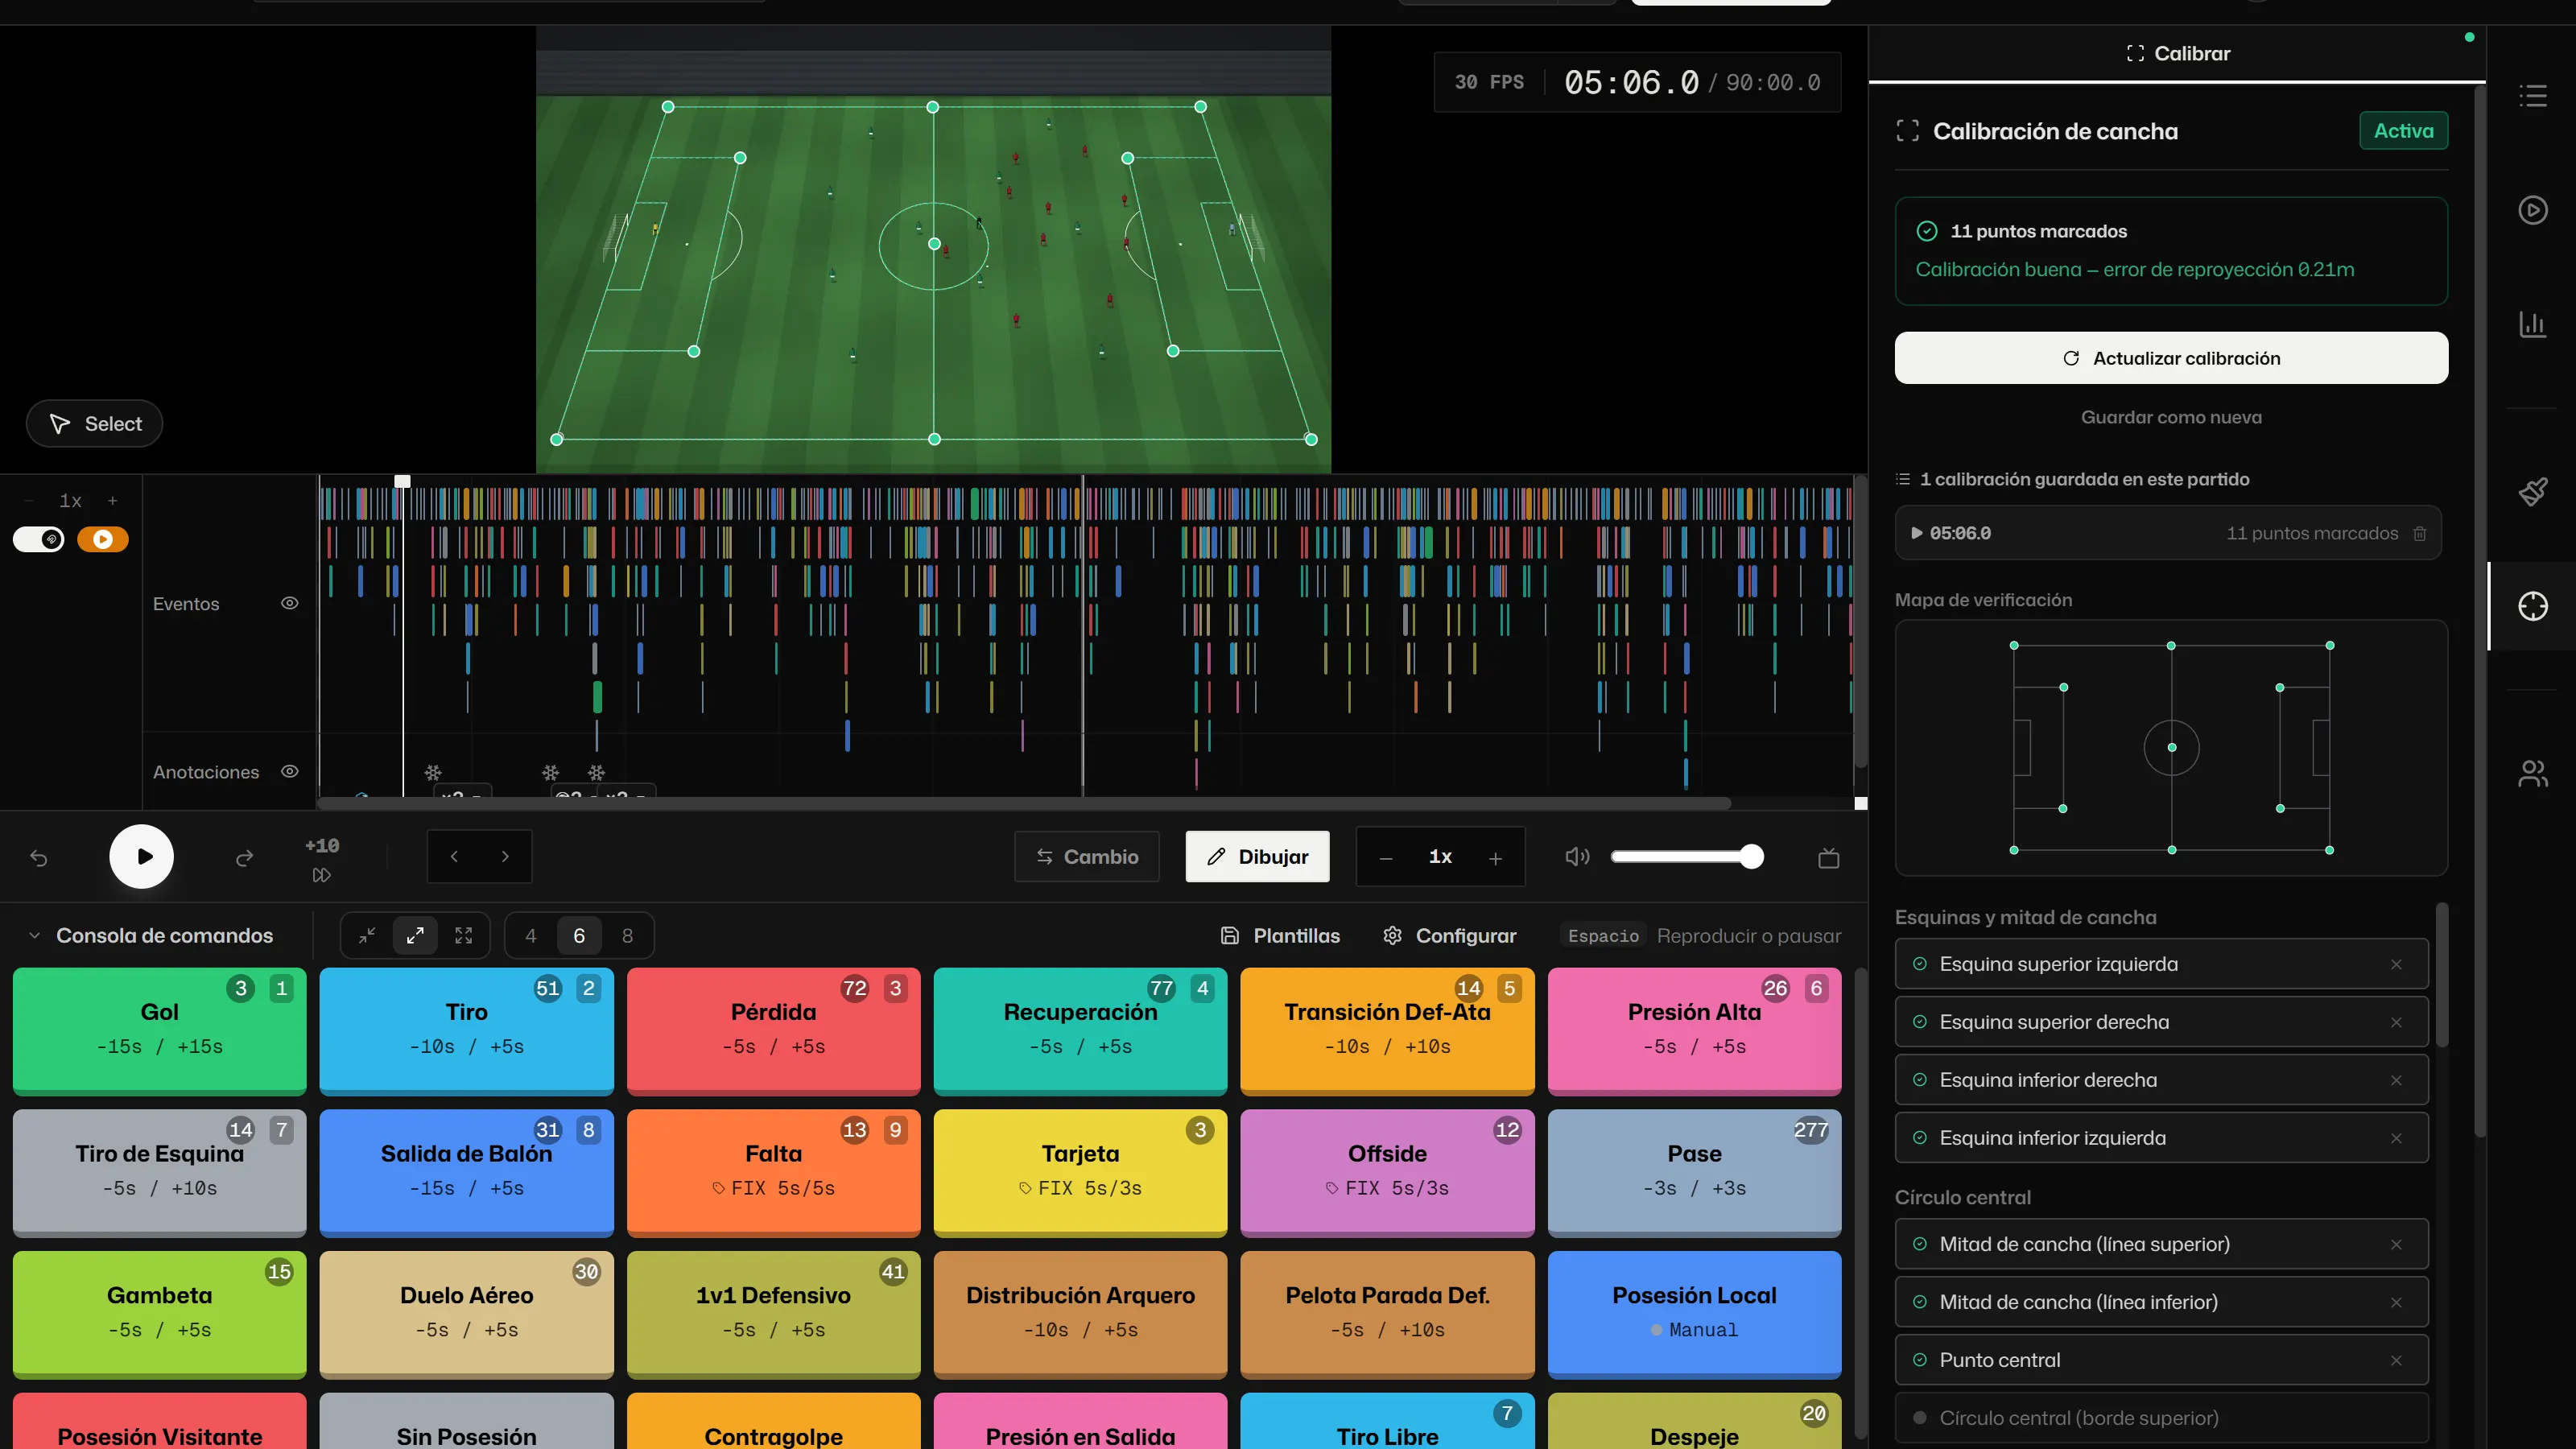
Mark where each action happened on the mini-map, or calibrate the pitch with four points in the video and place it by tapping the image. The calibration tells you its error in metres, so you know how far to trust it.
[04]Numbers
Numbers you can defend in the meeting.
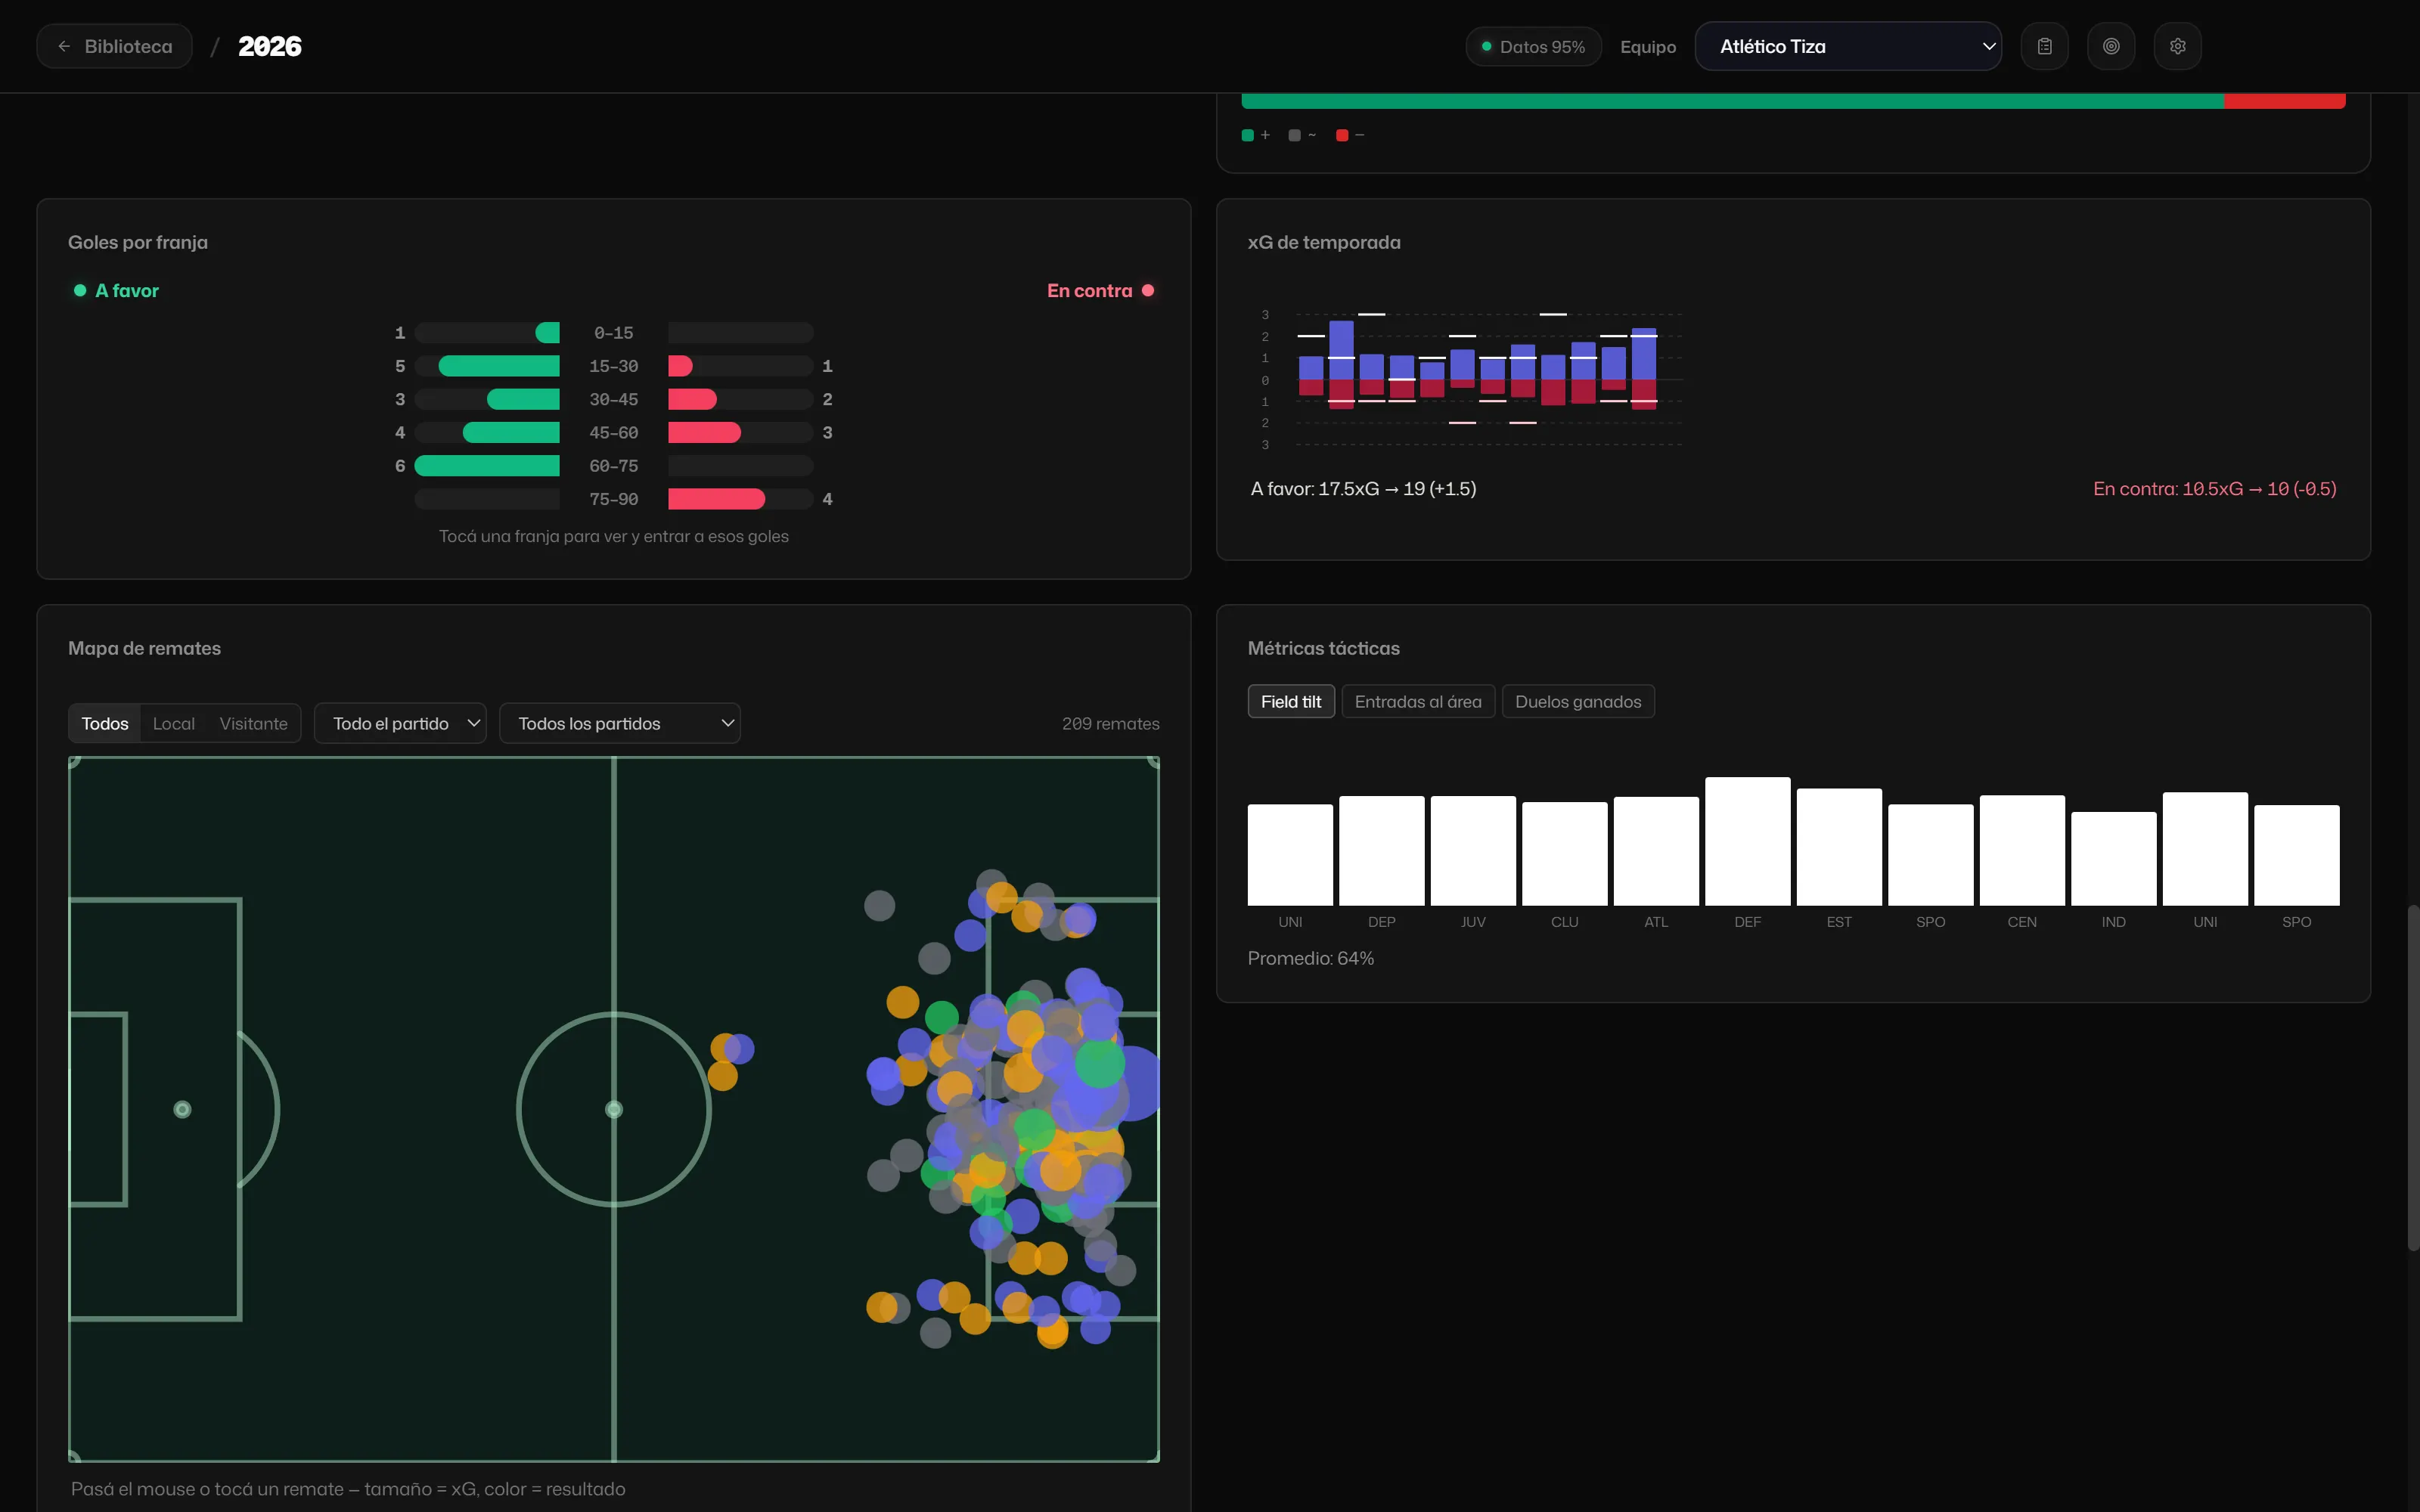
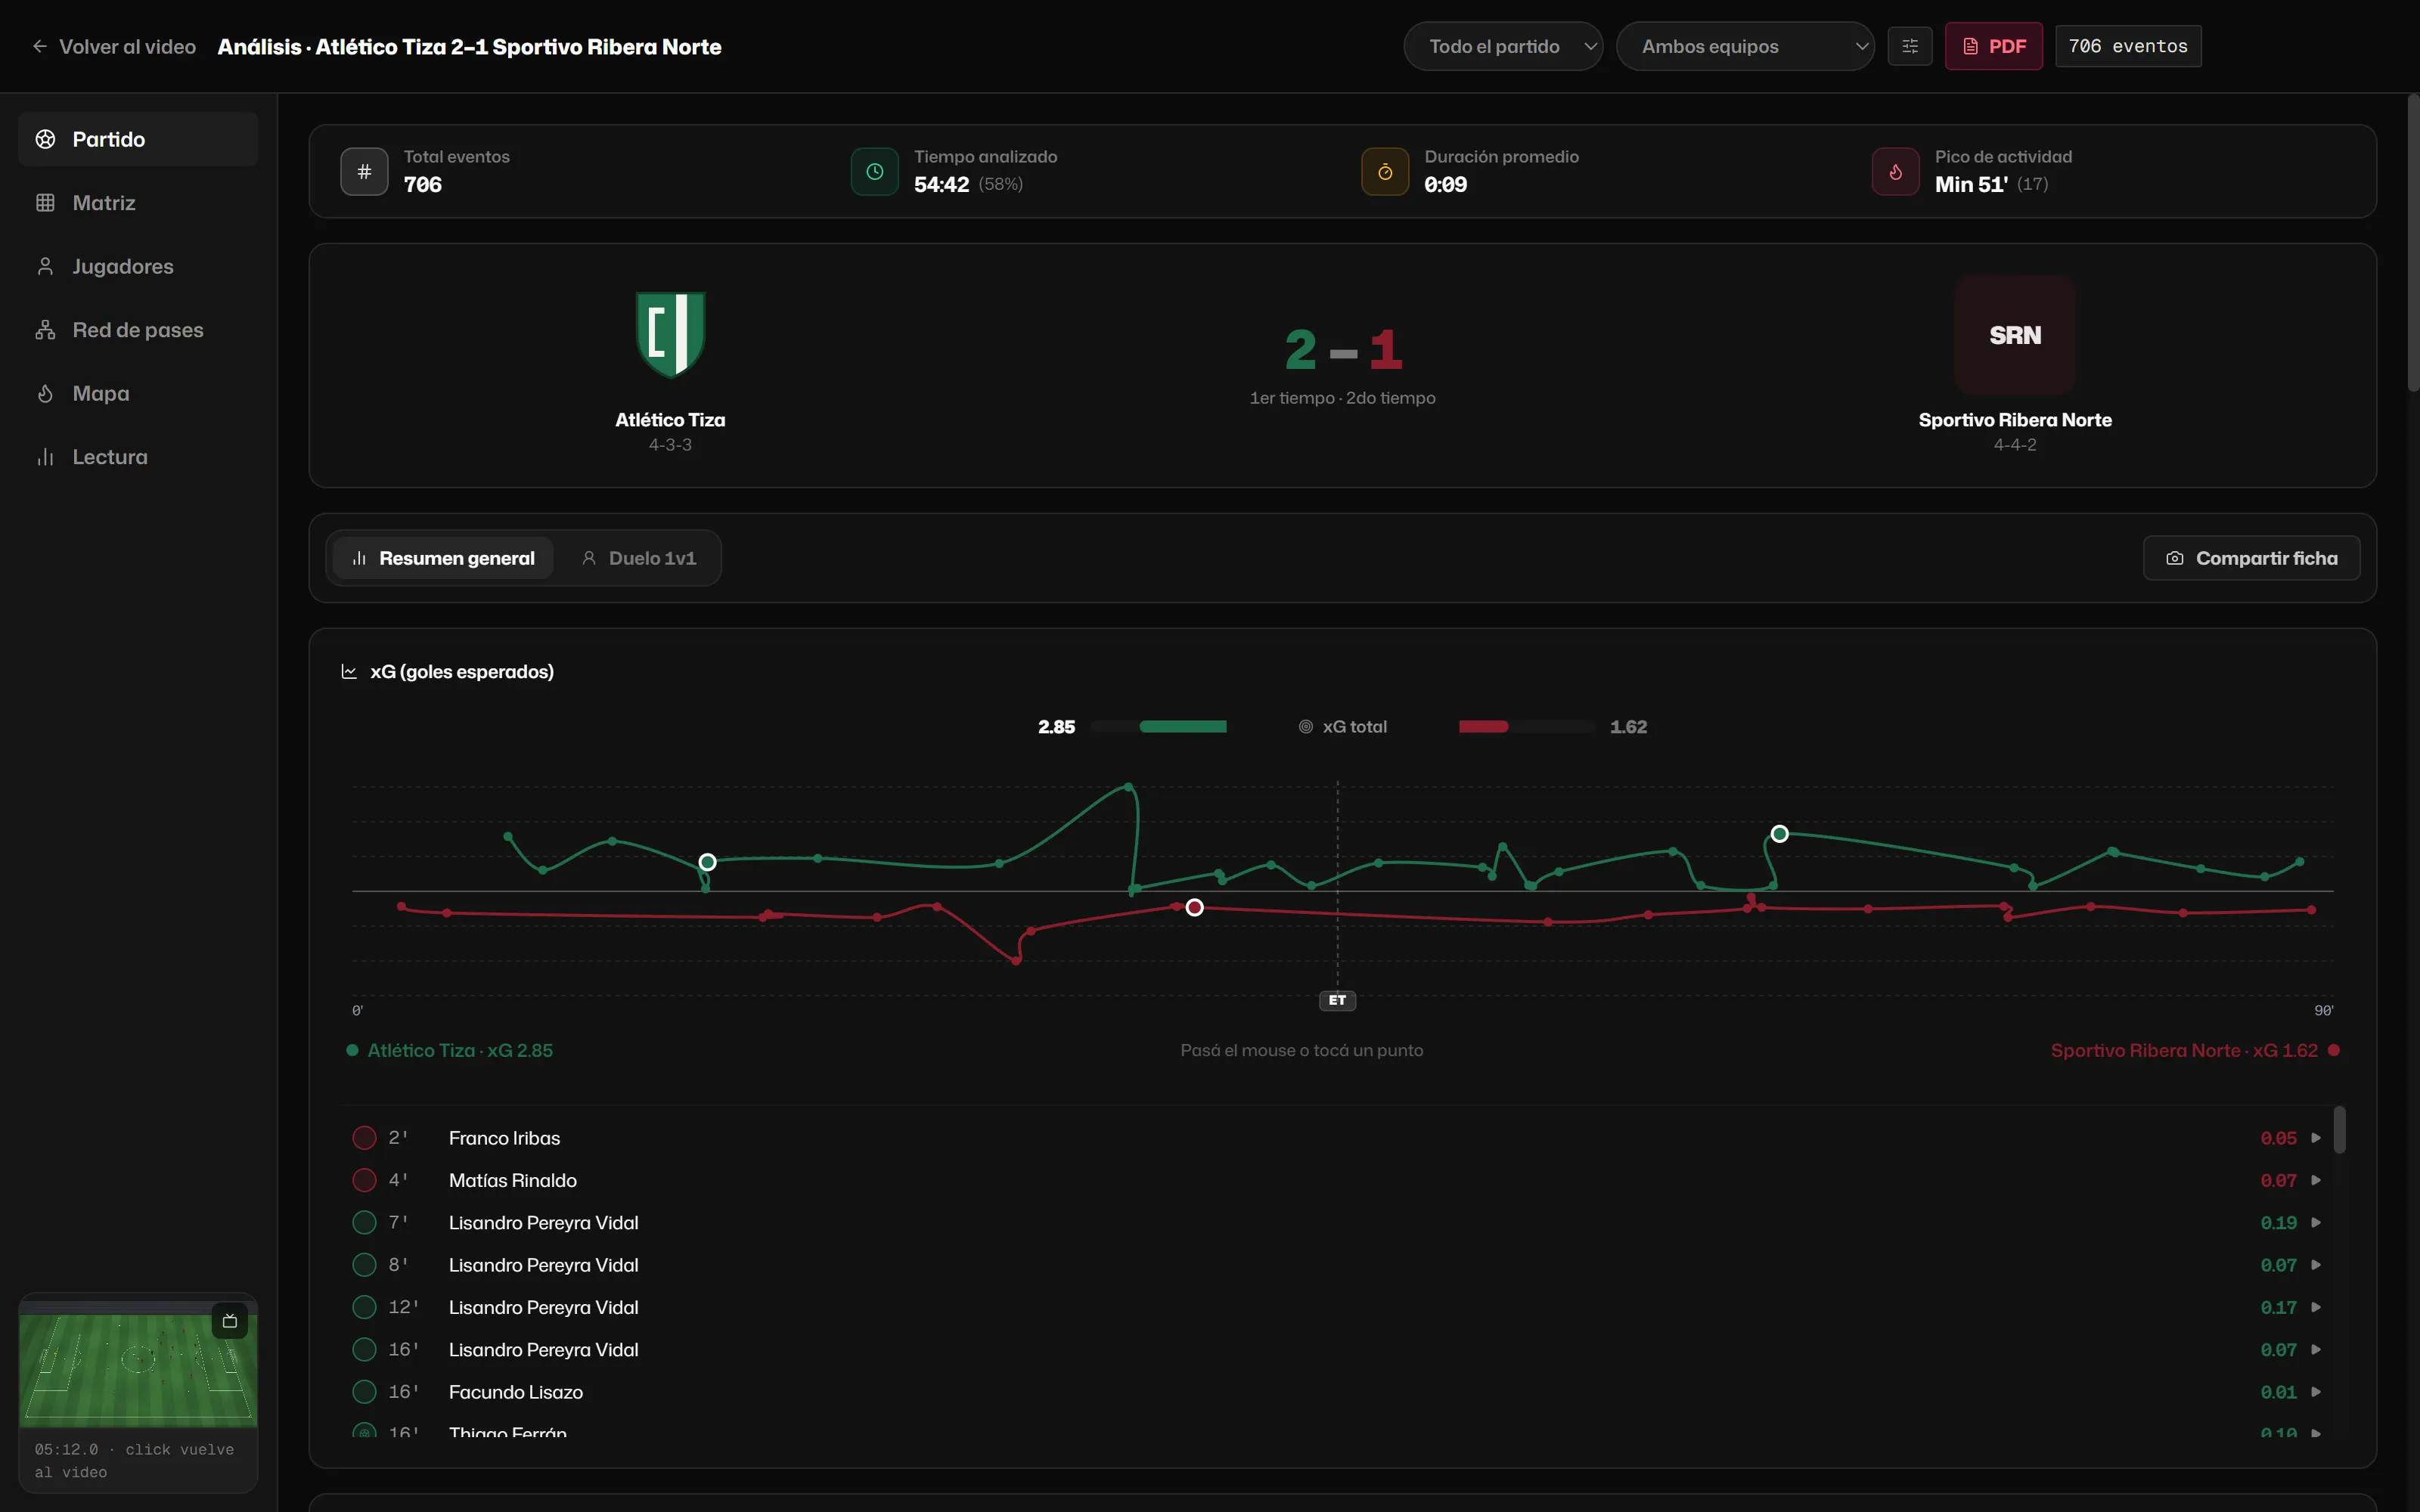
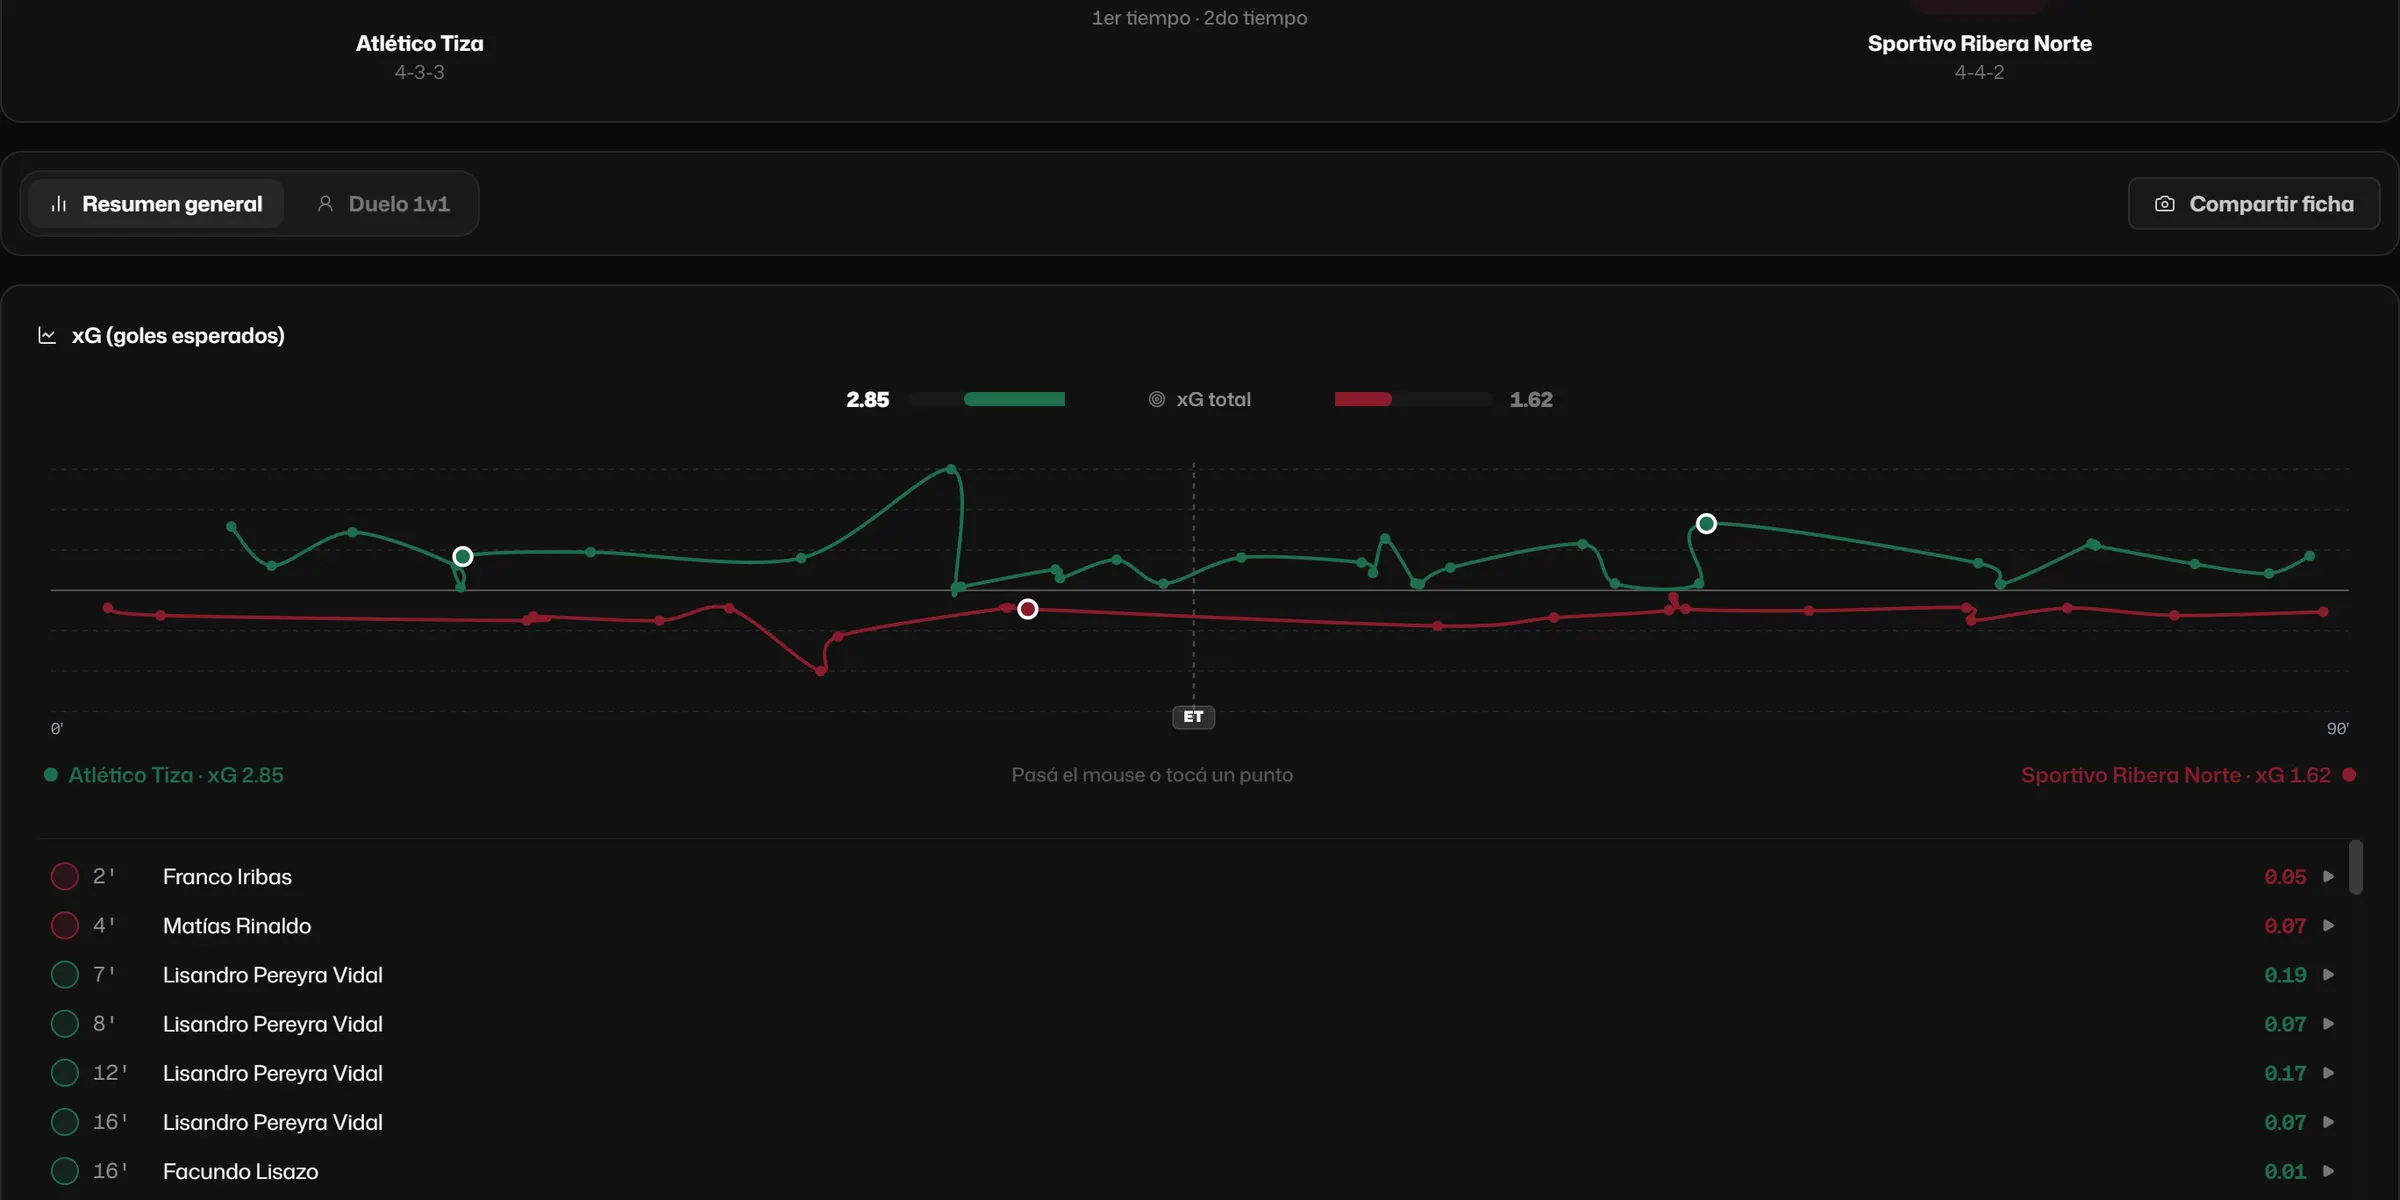
Our own xG model, xG race, PPDA, field tilt, box entries, duels, pass network and the actions-per-minute matrix. Every metric explains how it is calculated and what you need to tag to see it. If something is missing, it shows a dash instead of a zero.
[05]Output
It goes wherever you need it.
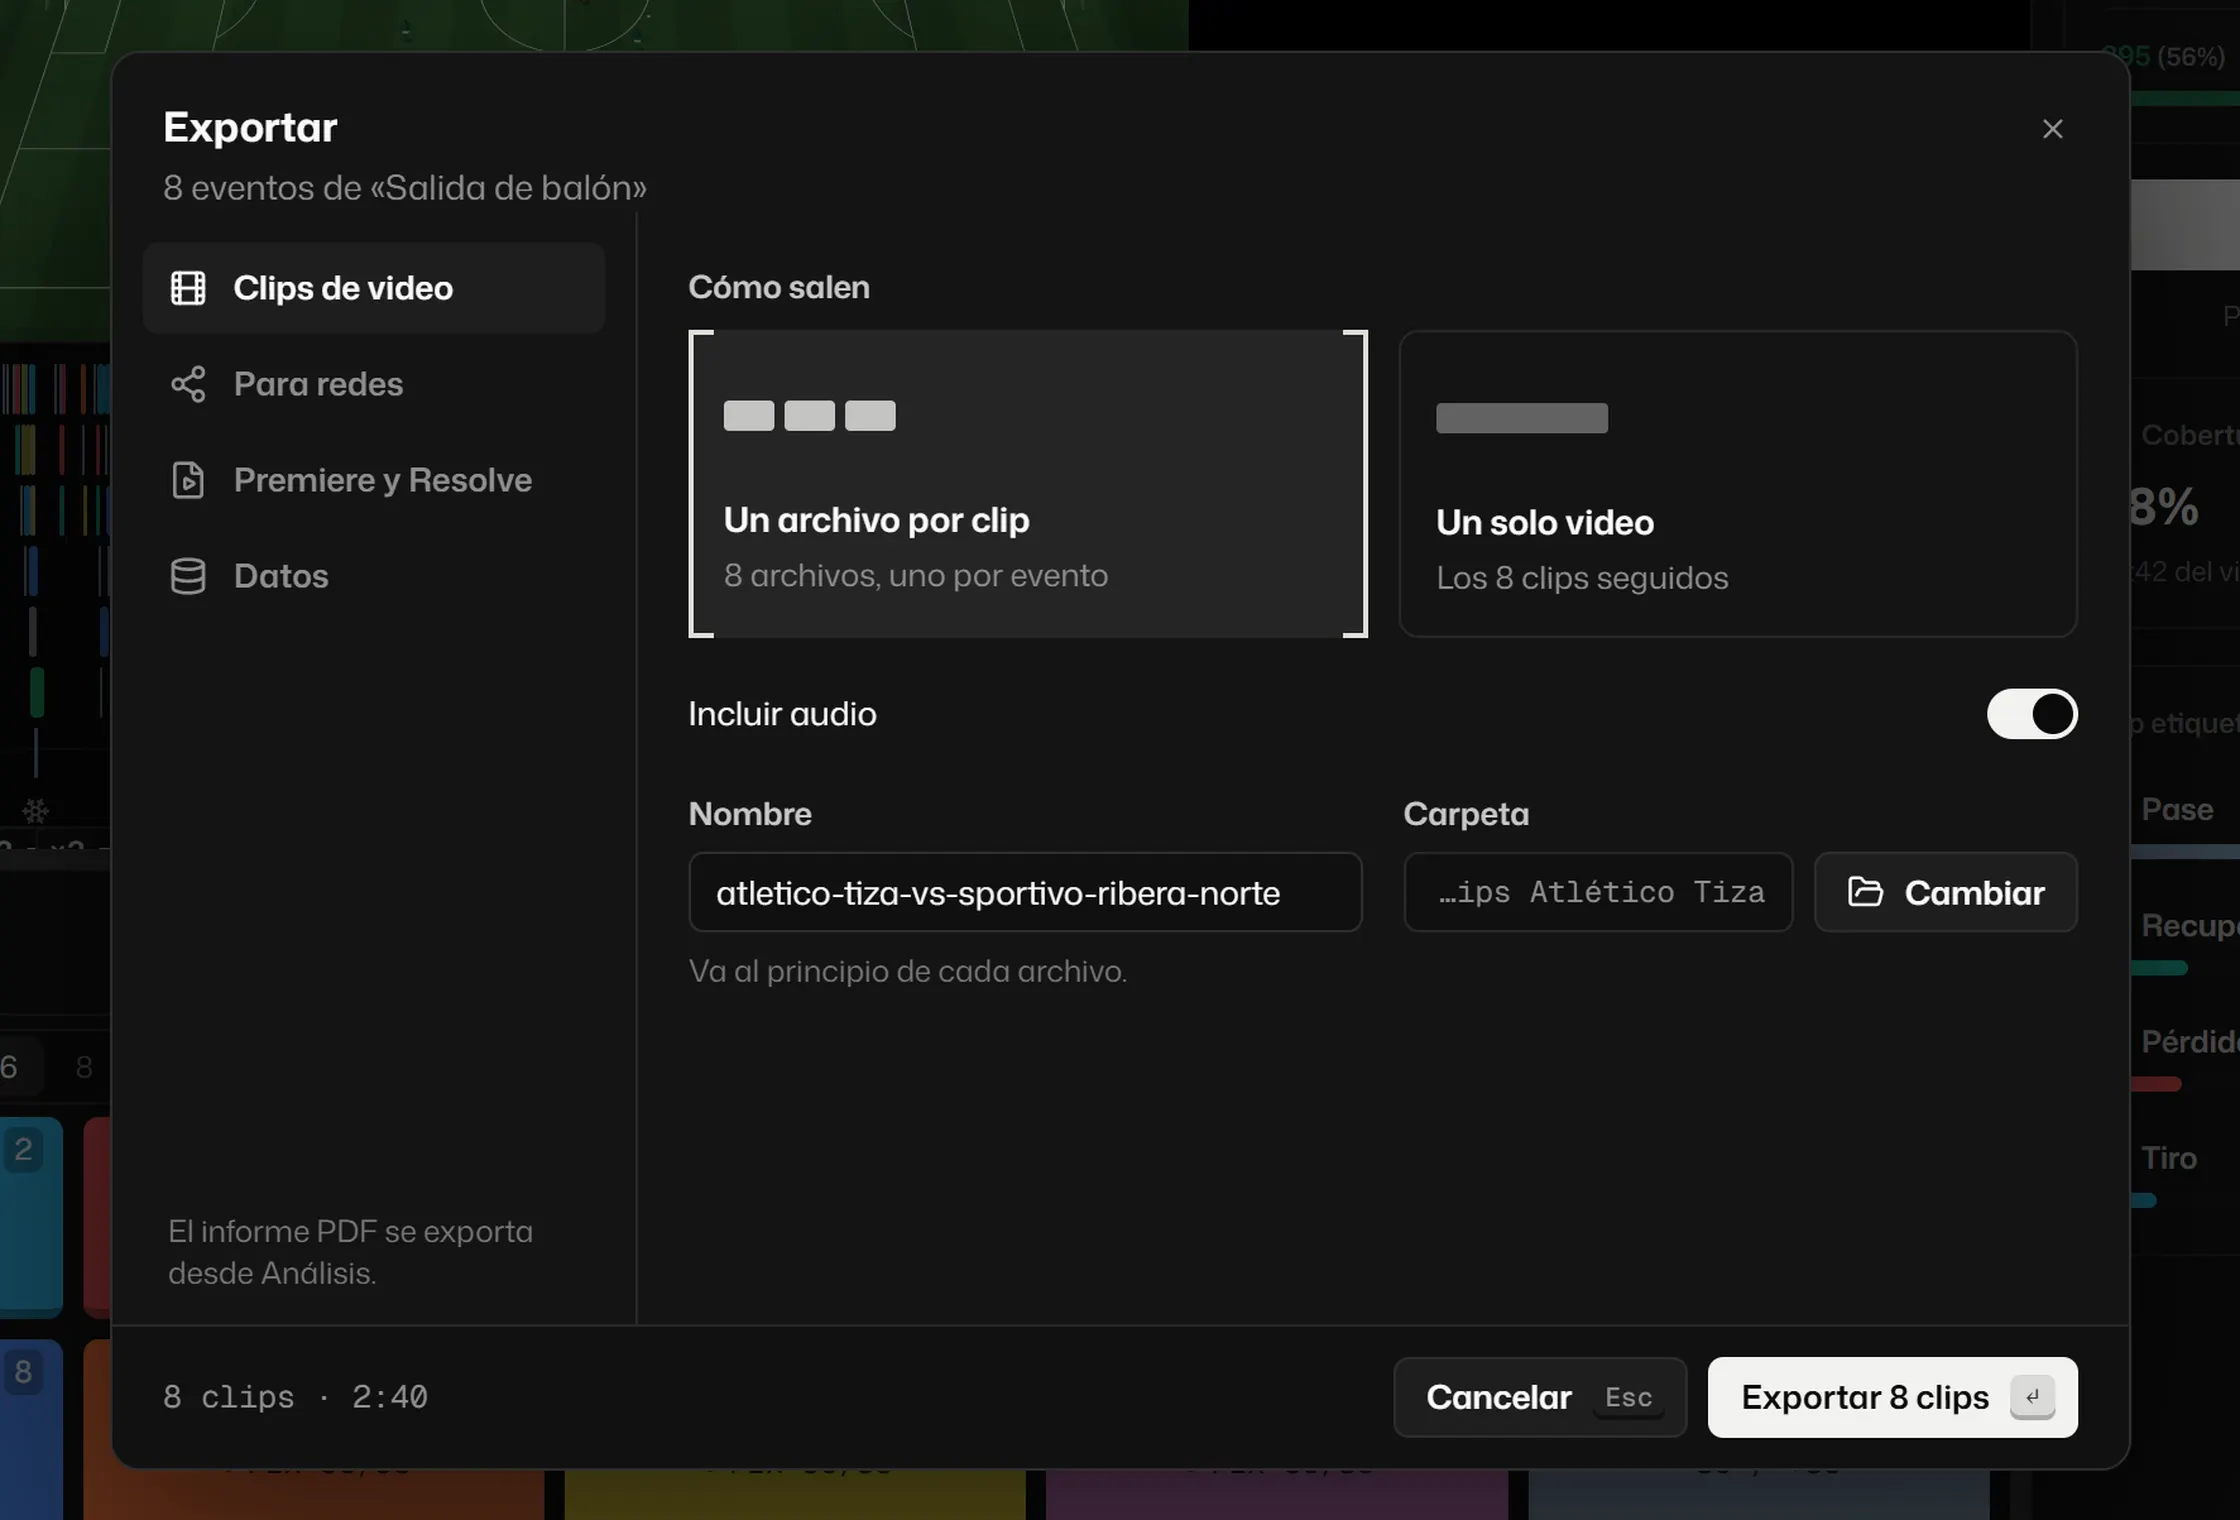
- MP4 clips, one per action or all in a single video, with the drawings burned in.
- XML for Premiere, DaVinci Resolve and Final Cut Pro, with drawings as separate layers.
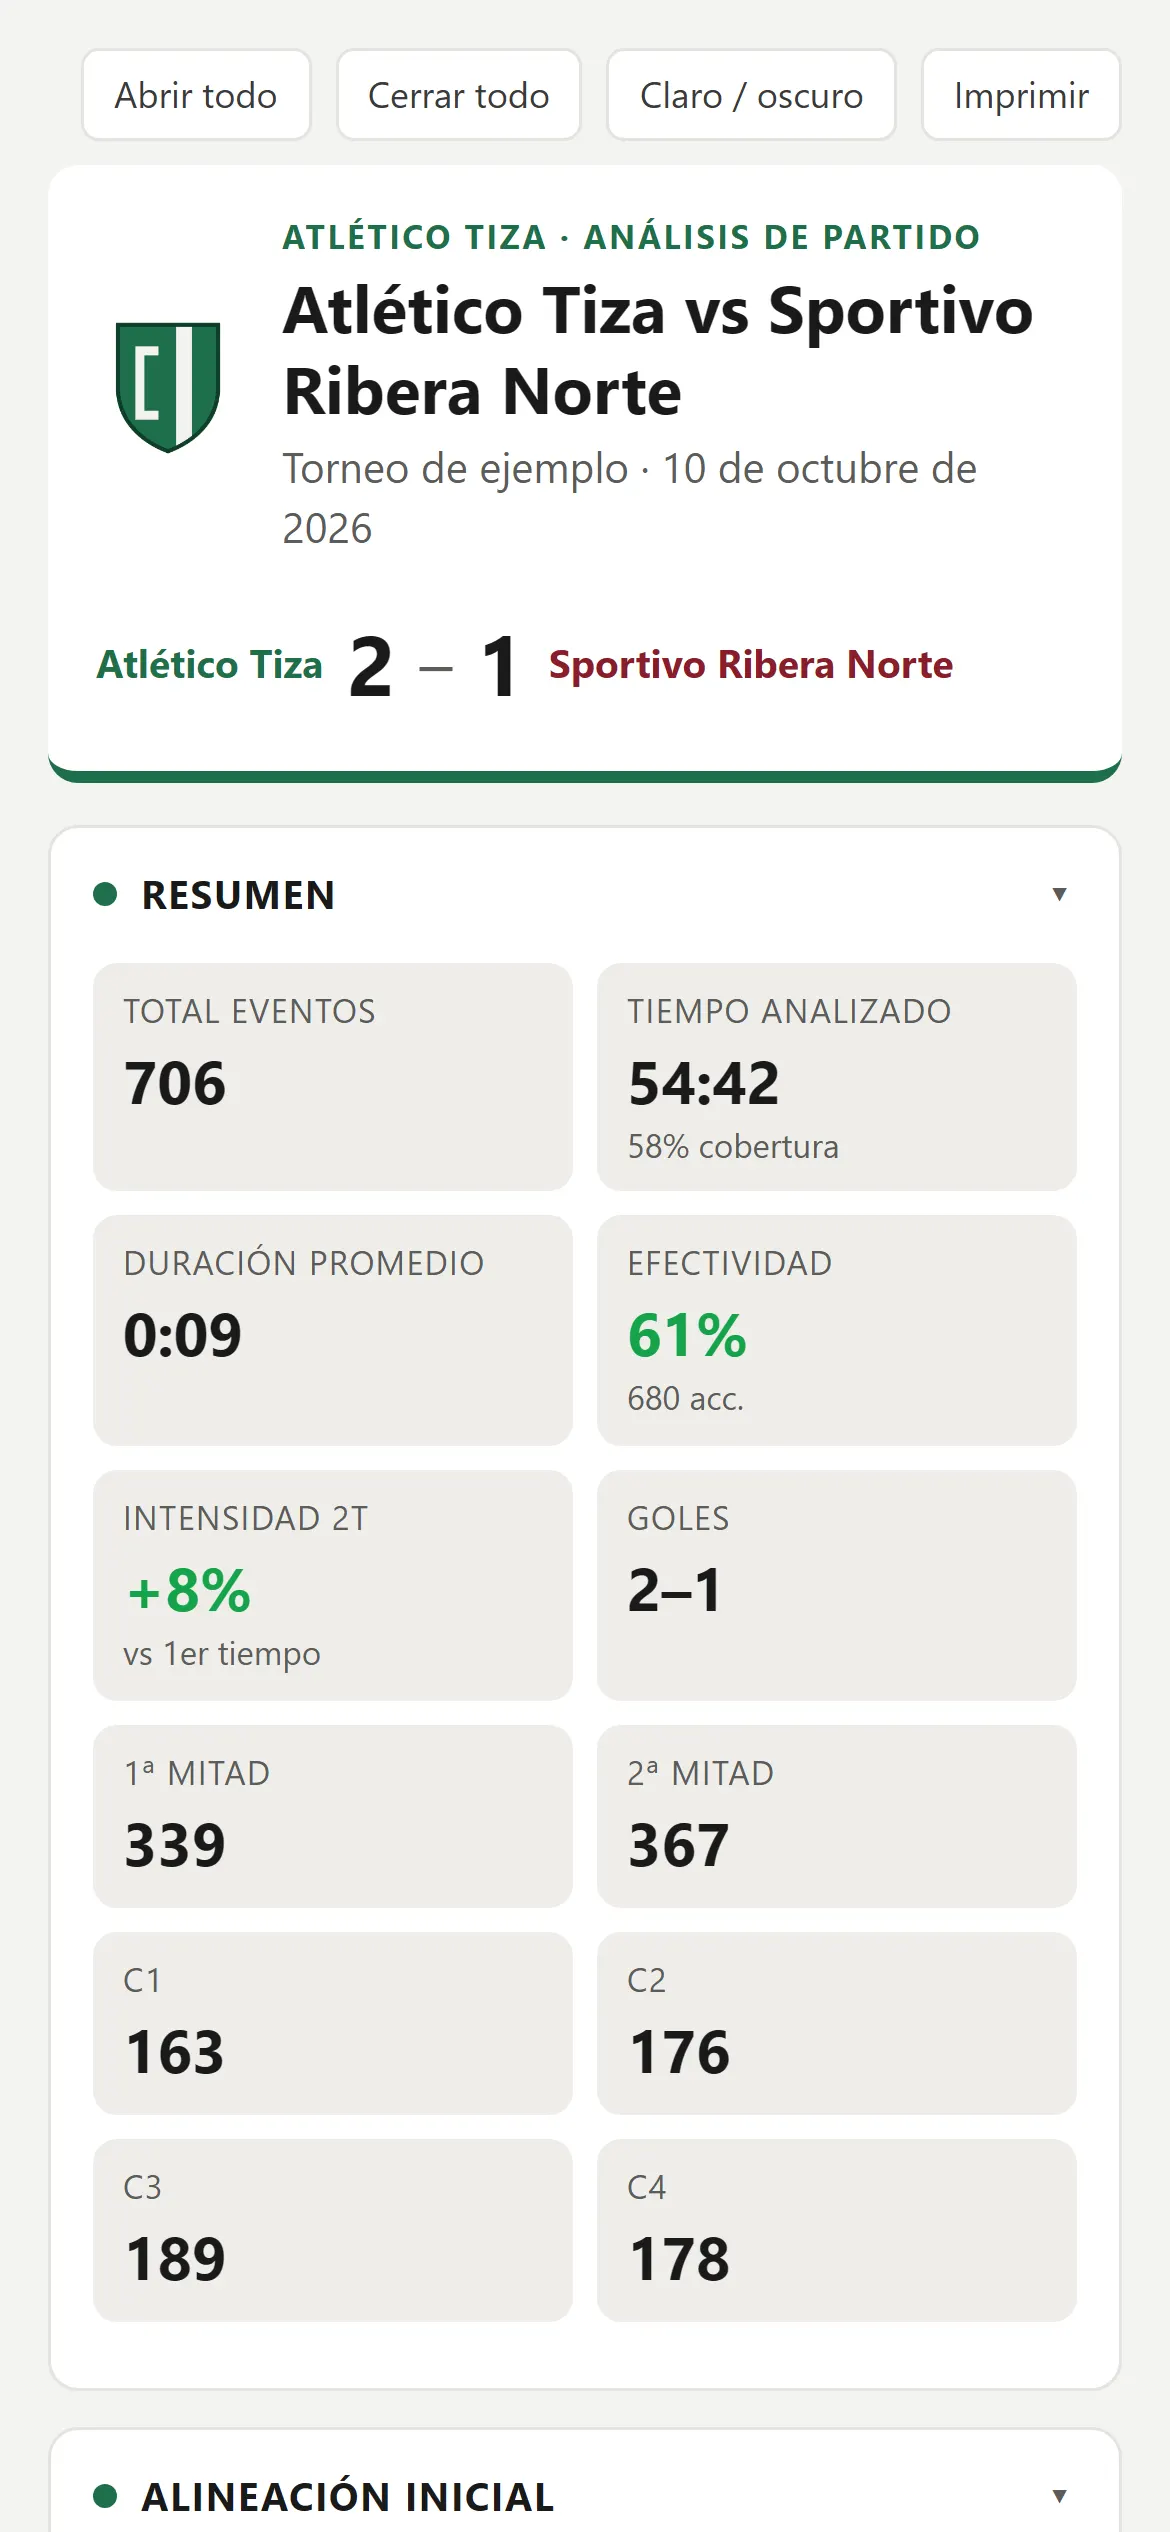
- PDF report, or HTML to send over WhatsApp and open on a phone.
- Data in CSV and JSON.
[06]Bring your work
What you already tagged is not lost.
If you come from another tool, import the match XML: tags and events are added to the project and you carry on from there.
[07]Season
And then, the season.
Every saved match adds to the season: points and expected points, xG, shot map, goals by 15-minute band, your set pieces and the opponent’s. Tap a number and see the clips.